Assignment 1: Laboratory Electronics Basics
1. Primer on using your Analog Discovery 2
Oscilloscopes and function generators are two standard instruments found in electronics labs, and even in many biology labs. The Analog Discovery 2, or AD, is a portable device that incorporates the functionality of a basic function generator and oscilloscope onto your laptop.
A function generator produces well-controlled, dynamic voltage waveforms — like sine waves and square waves — with adjustable frequency and amplitude. These waveforms can be used as the input signal to other pieces of lab equipment in order to characterize or debug their behavior under controlled conditions (rather than using noisy biological signals).
An oscilloscope measures voltage signals and plots them as they vary over time. Most oscilloscopes can measure multiple signal channels simultaneously (typically 2 or 4), and can be triggered to only acquire data at certain “interesting” times, such as when the input voltage crosses a threshold. Oscilloscopes are extremely useful for observing the output signals of any laboratory instrument. If you have an oscilloscope in lab, we strongly urge you to learn how to use it in addition to the AD that we describe below. The ability to see electrical signals is a lab superpower.
1.1 Setting up your AD hardware and Waveforms software
- Connect your AD to your computer using the USB cable provided.
- Download and install the Waveforms software from Digilent (You’ll have to create a free account first.).
1.2 Understanding the AD’s input and output wires
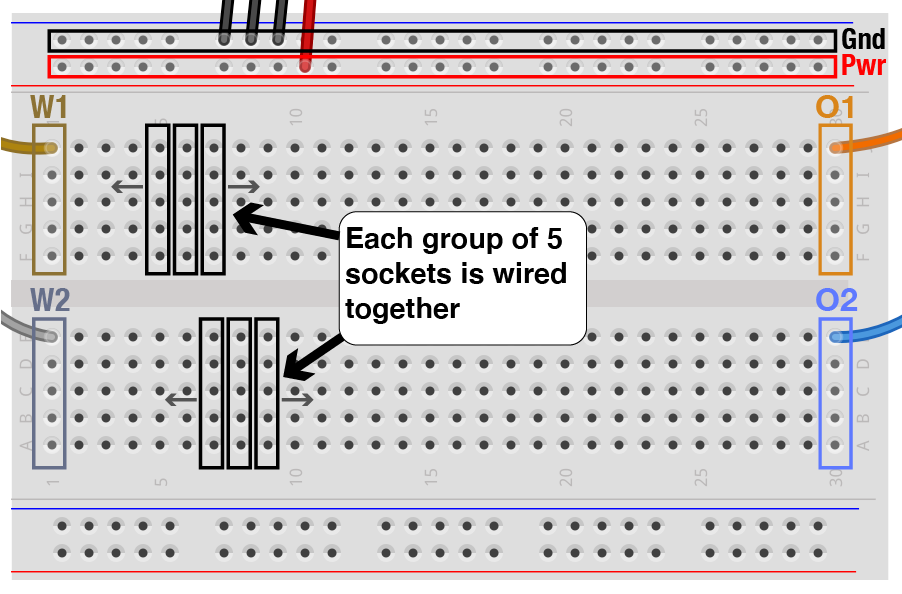
Function generator output: We’ve set up the breadboard so that the output of the AD’s two function generator channels are wired to the first column of the breadboard, column 1. Channel W1 goes to rows F–J (near the top), and W2 goes to rows A–E.
Oscilloscope inputs: Similarly the two input channels to the oscilloscope have been wired to the the final column of the breadboard, column 30. Channel 1 (O1) is on top (rows F–J), and channel 2 (O2) is below (rows A–E).
Breadboard connections: The white breadboard allows you to quickly make connections between wires and components without the need to solder. Each column has two groups of five sockets that are internally wired together, as shown in the diagram. All wires and components plugged into the same group will have an electrical connection (i.e., they will be “wired together”). Furthermore, the two rows at the top of the breadboard, labeled “+” and “-“, are special. Each of these rows is wired up as one single group that spans the length of the breadboard. We have pre-wired them so that the “-“ row is Ground and the “+” row is connected to the AD’s positive power output.
1.3 Wiring up your first project
In most projects, signals will flow from left to right. Typically we will use the function generators (W1 and W2, in breadboard column 1) to generate signals that might get modified by other circuit elements in the middle of the breadboard. Then the final output signal of that circuit will be sent to the oscilloscope (O1 and O2 in the rightmost column) to be displayed on your computer.
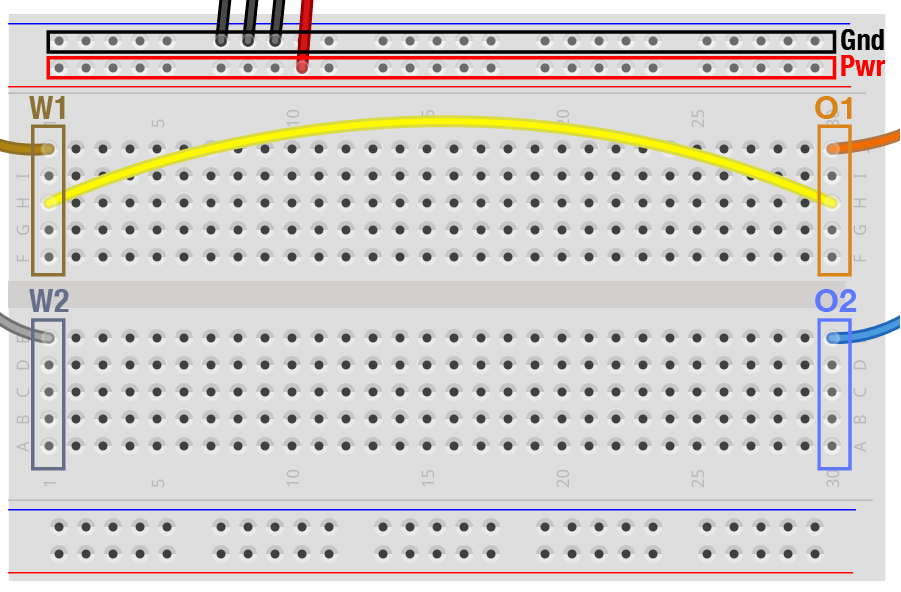
To test out the basic elements of system, we will first generate a simple voltage signal and measure it directly on the oscilloscope — without any intervening circuitry. Use a jumper wire to connect W1 to O1 — in other words connect the output of the function generator to the input of the oscilloscope. In the diagram below, the yellow wire shows one way to make this connection.
Connecting W1 to O1
Next run Waveforms on your computer and select the Wavegen tab from the list on the left. The default settings will generate a 1 kHz sine wave of amplitude 1 V. Leave the settings alone and press the green Run button. If all went well, you should be generating a sine wave in channel W1.
While the function generator is still running, press the Welcome button at the top of the window ( ) and open up a new
 Scope window. (You can switch between tabbed windows or side-by-side windows by selecting between these icons ( ) in the upper right hand corner of the window.) Next press
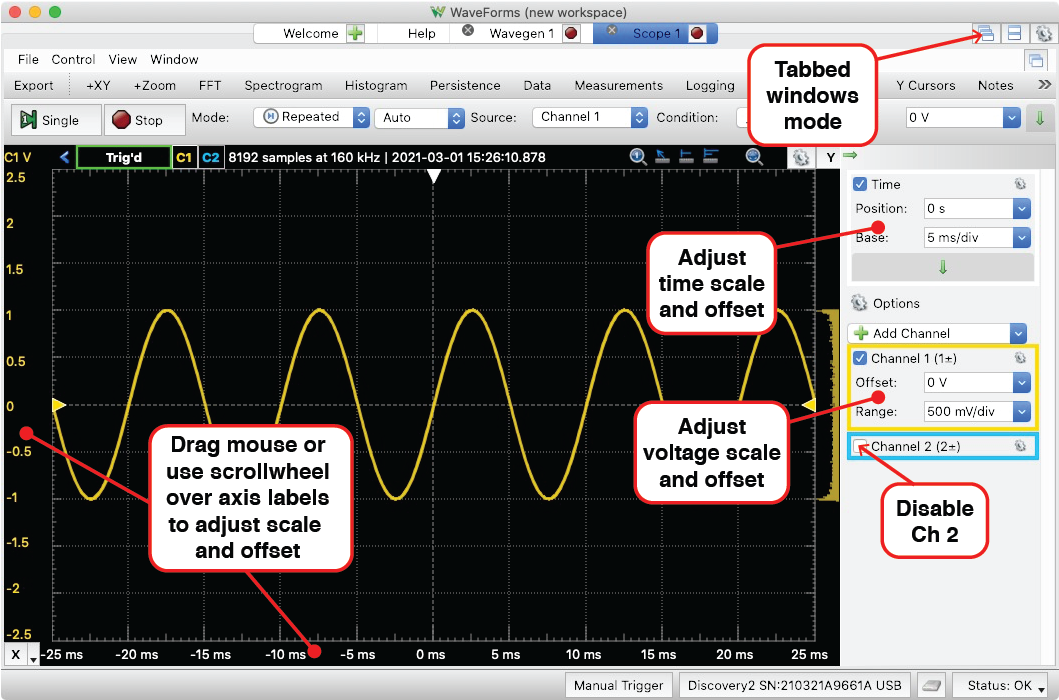
 Run on the scope window. You should see a yellow/orange sine wave displayed. Since we are not using the second channel (blue trace) for now, you can turn it off by deselecting the Channel 2 check mark on the right. Use the scope controls to adjust the time and voltage scales. Check the axis labels to confirm that the sine wave does have an amplitude of 1 V (i.e., it spans the range -1 to 1 V) and that its frequency is 1 kHz (i.e., 1 ms from the peak of one cycle to the next).
Congratulations. You have set up your AD hardware and software correctly, and you have begun to learn how to use them. If you encountered any problems, please check in with the instructors.
Basic settings for the oscilloscope window
2. Voltage divider circuit
2.1 Basic divider
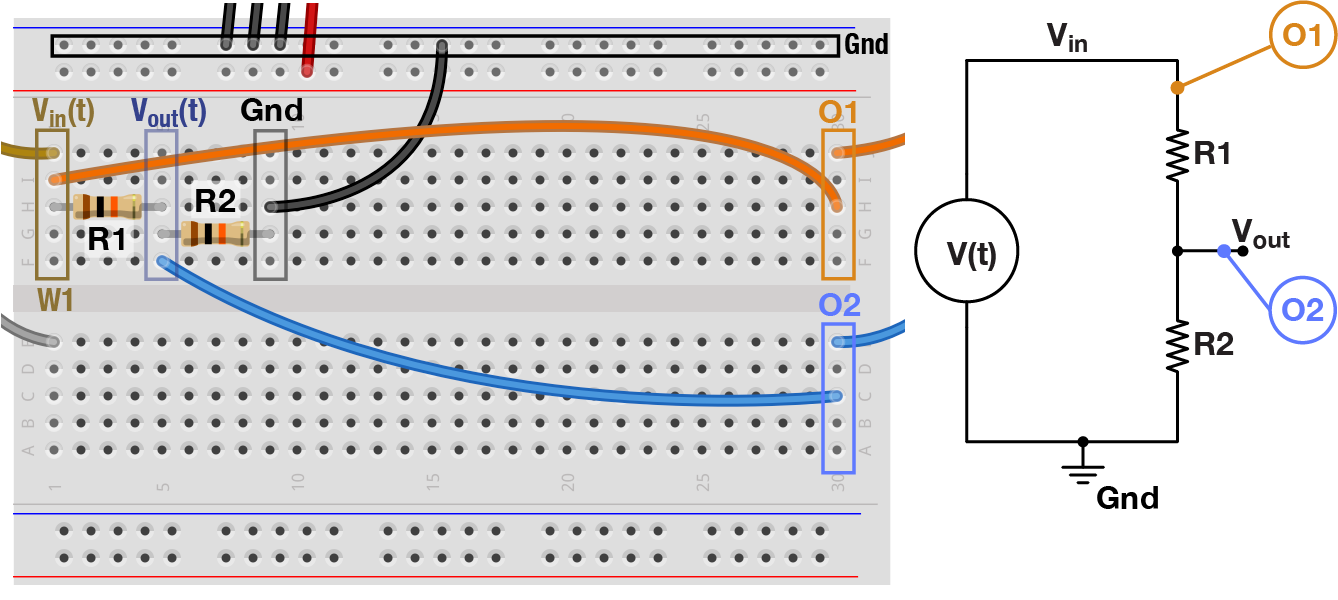
The voltage divider is a fundamental circuit motif. Wire up a simple divider circuit by following the diagram below. In this circuit, the signal from W1 passes through two 10kΩ resistors on its path to ground. The two oscilloscope channels are wired up so that channel 1 (O1) records the input signal ($V_{in}$ or W1), and channel 2 (O2) records the output signal ($V_{out}$). After wiring up this circuit, make sure your function generator is still running and is set to an amplitude of 1 V. Now turn on both channels of the oscilloscope and observe the difference in amplitude between $V_{in}$ and $V_{out}$. (Note that each oscilloscope channel has its own setting for voltage scale. Pay attention to both voltage scales as you make the comparison.)
Q 1.1 We provided you with several resistor values (1 kΩ, 3.3 kΩ, 4.7 kΩ, 10 kΩ, 50 kΩ, 100 kΩ). Which of these resistors could you swap in for R1 and R2 to make the amplitude of $V_{out}$ ~0.75 V?
Make the replacement and find out if you were correct.
Resistive divider
2.2 Adjustable divider
In section 2.1, you adjusted the ratio of a voltage divider by selecting different pairs of resistors. A device called a potentiometer functions as an adjustable divider. A potentiometer (“pot” for short) is a three-pin device. Pins 1 and 3 are on opposite ends of a resistor (10 kΩ, in our case). Pin 2 connects to a point somewhere along the middle of that resistor, setting up a voltage divider. By turning the potentiometer’s knob, you physically slide pin 2 up and down along the resistor, thereby adjusting the resistance between pins 1 & 2 ($R_1$) and pins 2 & 3 ($R_2$), while at all times $R_1 + R_2 = \mathrm{10 k\Omega}$.
Wire up the circuit shown below using the provided pot. Confirm that you can easily vary the amplitude of $V_{out}$ by turning the knob on the pot.
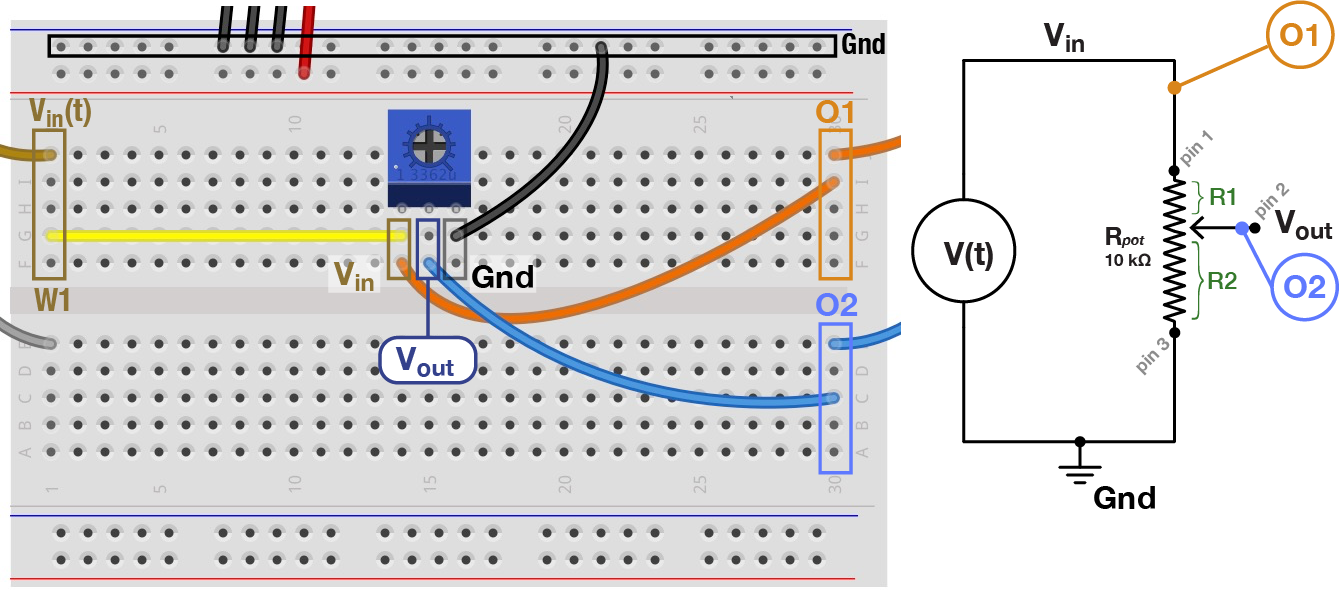
Potentiometer Circuit
2.3 Input & output impedance
The attenuating effect of voltage dividers often creep up when trying to record a signal from a source with high output impedance (resistance). In neuroscience, a common example is making extracellular or intracellular recordings. In both of these cases the electrode has high resistance, between many hundreds of kΩ to tens of MΩ.
We will model this situation by adding a 1 MΩ resistor to the output of W1. This resistor stands in for a high-resistance electrode, and can be considered part of the signal source we are trying to measure. The jumper wire connects the output of this circuit to oscilloscope channel O1. This setup simulates what would happen if you wired up your intra/extracellular electrode directly to your oscilloscope or data acquisition box.
Q1.2 When the amplitude of W1 is set to 1 V, what amplitude do you measure on O1?
Q1.3 Why? What can you infer about the input impedance (resistance) of the oscilloscope?
Q1.4a Taking into account the oscilloscope’s estimated input impedance, would this oscilloscope be a good tool to accurately measure the voltage output of an extracellular electrode with $R_{out}$ = 100 kΩ?
Q1.4b Would this oscilloscope be a good tool to accurately measure the voltage on the output pin of an Arduino with $R_{out}$ = 10 Ω?
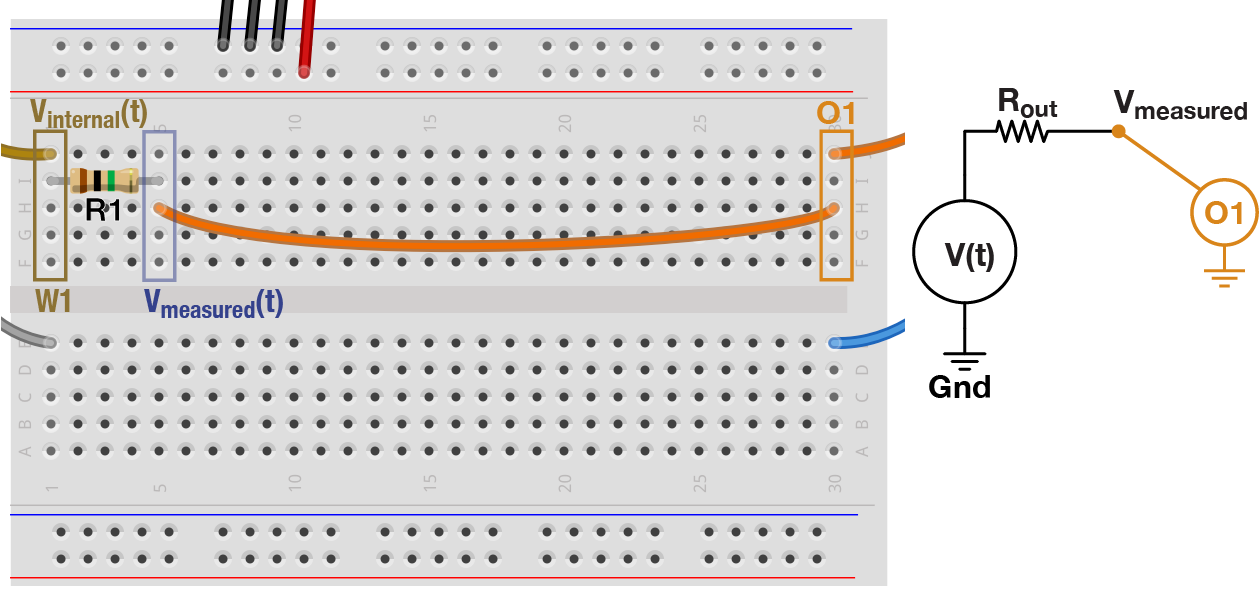
High output impedance circuit
3. Capacitance
3.1 RC Filters
As described in the lecture, a capacitor is a device that can transmit high-frequency signals and blocks low-frequencies (i.e., it has low resistance at high frequencies and vice versa). We can take advantage of this property to build a circuit, known as an RC filter, that selectively attenuates certain frequencies. To do this, we will wire up a voltage divider circuit with one resistor and one capacitor.
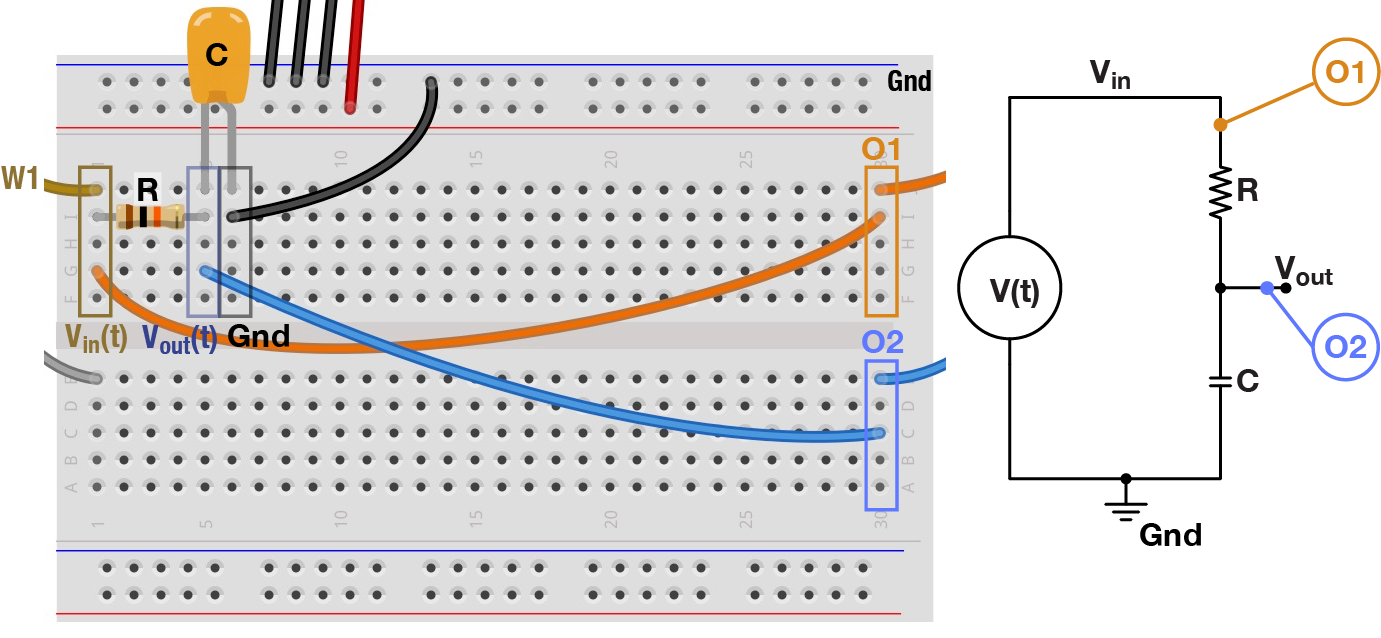
RC Circuit #1
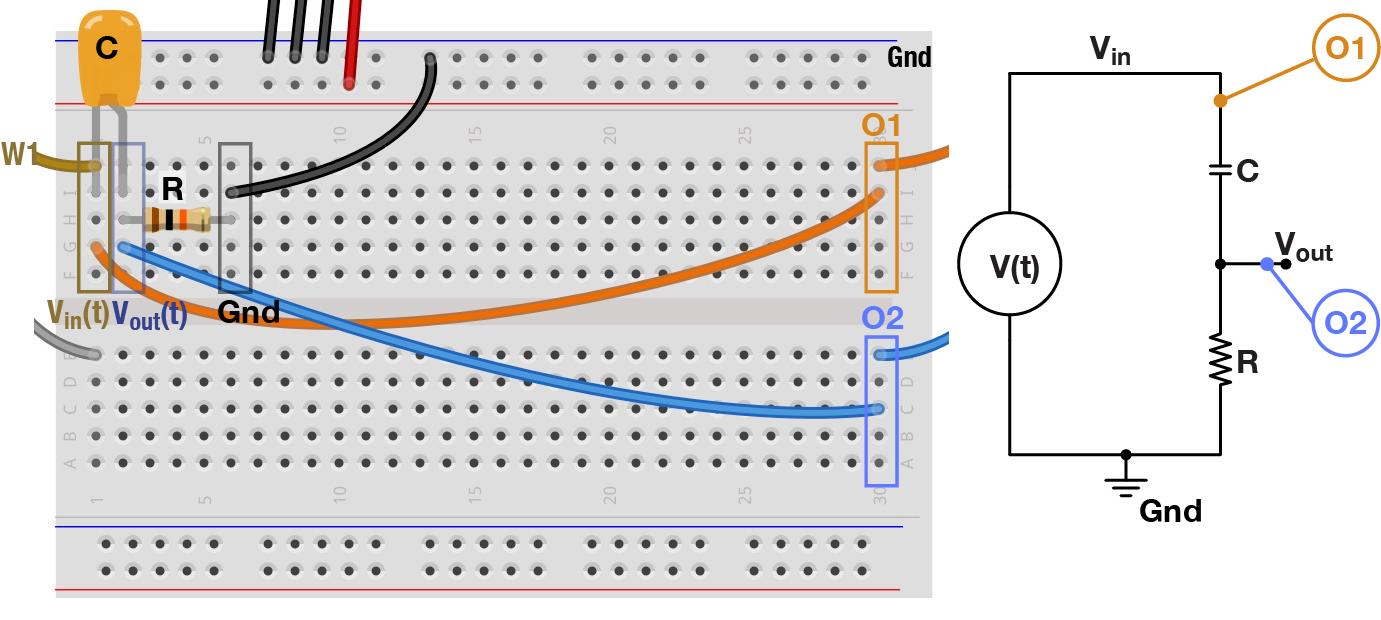
RC Circuit #2
Wire up the the two filters in the figure above, using the 10 kΩ resistor and the 0.1 µF capacitor. For each filter, generate sine waves on W1 at a range of frequencies: 1, 10, 100, 1000 Hz. Turn on both oscilloscope channels to view both the original and filtered waveforms.
Q1.5 Which filter attenuates high frequencies? Why?
Q1.6 Besides amplitude, what else is different between the original and filtered waves?
Your AD has a built-in tool to characterize filters by automating the process of sending sine waves of different frequencies into the filter and quantifying the output: Keep your circuit wired up as is (with O1 monitoring the original waveform and O2 recording the filtered one). Go to the Welcome tab and select the Network tool. Now in the Network tab, adjust the settings so that Scale: Logarithmic, Start: 10 Hz, and Stop: 100 kHz. Also, in the Magnitude panel on the right, set Units: gain (X). Finally, press Run to generate what is known as a Bode Plot. The top of the plot shows how the filtered signal amplitude changes with frequency, and the bottom plot displays changes in phase.
BONUS: 3.2 Capacitive coupling
This question will venture into some concepts that weren’t covered in the first lecture. Please work through the problem if you have time, but don’t worry if it doesn’t fully make sense. We will return to capacitive coupling in the next lecture.
Any pair of conductors will have some capacitance between them, though typically its magnitude is insignificant. But when two circuit elements are in close proximity over a large surface area, their capacitance can have a measurable effect on circuit behavior. This is known as stray, or parasitic, capacitance when it is unintended, and can lead to capacitive coupling, especially at high frequencies.
Use the function generator to output a 5 Hz sine wave on W1 and a 100 Hz square wave on W2. Keep the default amplitude of 1 V for both signals. These two signals represent two independent signals — one analog, one digital — both present in the same rig.
Capacitive coupling often occurs when two neighboring signal wires run in parallel over a long distance. To simulate this situation, connect the two waveform channels (W1 and W2) to pins 1 and 2 on the ribbon cable from your parts kit.
Record the sine wave on W1 by connecting the oscilloscope to pin 1 on the other side of the ribbon cable. In order to observe the effect of the capacitive coupling, you will have to disable the oscilloscope’s default smoothing by selecting Sample Mode: Min/Max from the Channel 1 gear menu (see figure).
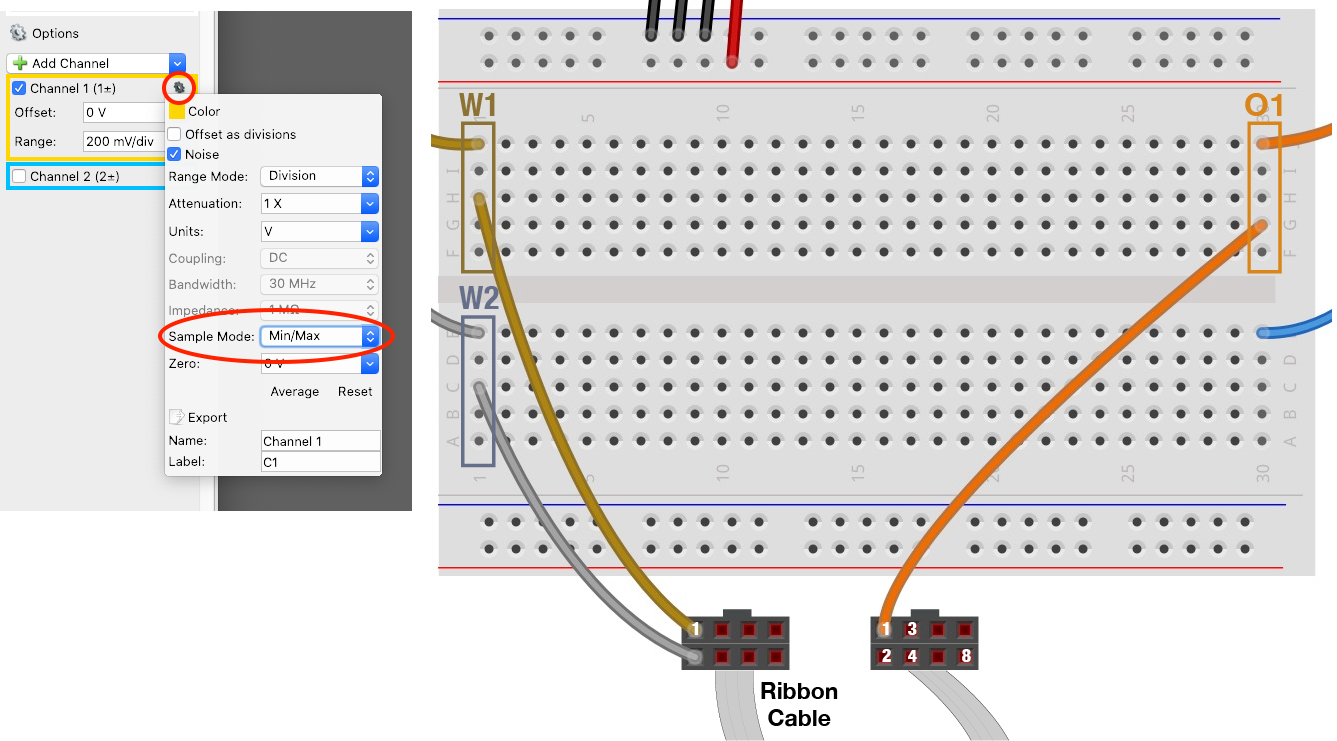
Capacitive coupling circuit
Q1.7 You should see a 5 Hz sine wave with capacitively coupled noise superimposed. What is the amplitude and shape of the noise?
Q1.8 How does the noise change if you move W2 from pin 2 to pin 8 on the ribbon cable? Why?
Parts List
- Analog Discovery 2, with W1, W2, O1, and O2 appropriately wired to a breadboard
- Assorted 6” jumpers
- Ribbon cable
- Capacitor: 0.1 µF
- Resistors: 1k, 3.3k, 4.7k, 10k, 51k, 100k, 1M
- Potentiometer, 10 kΩ
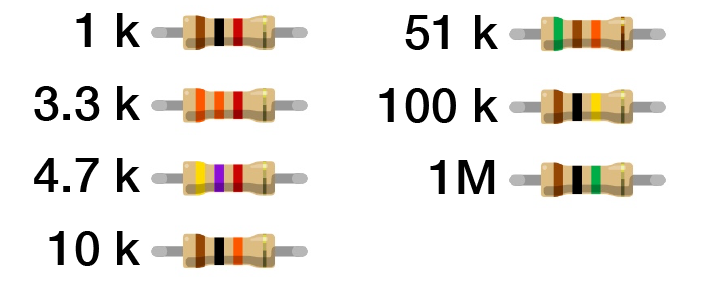
Resistor Color Guide